Graphic Trends - Sysbiotech buttons
Mooslackengasse 17, 1190 Vienna Austria
+43 660 990 4409

Graphic Trends

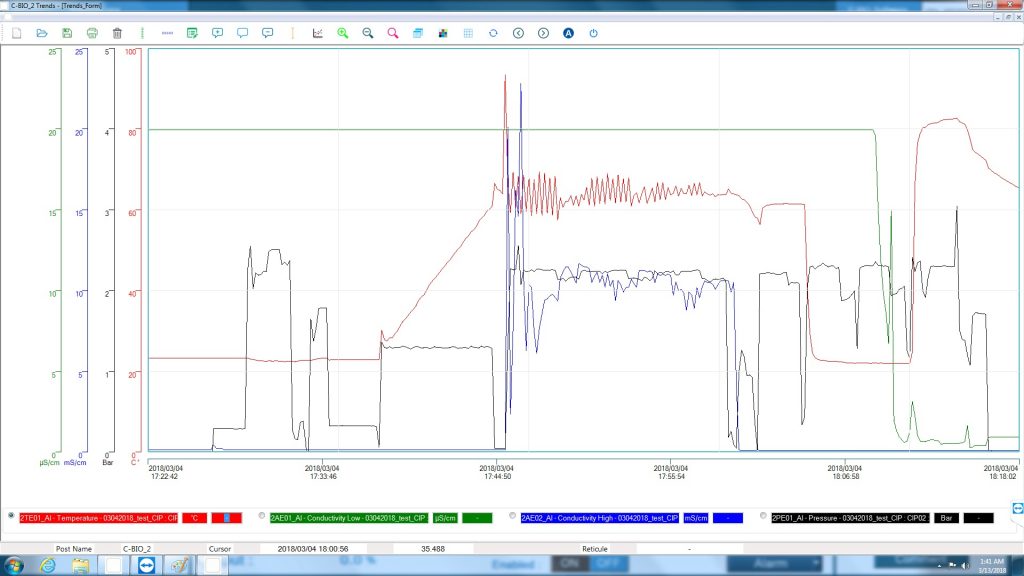
For proper analysis of your fermentation data our SCADA system has all necessary functions which gives you a wide range of possibilities to generate reports and export data. With our system you can easily monitor on-line parameters for your fermentation process + export your experimental data to Excel for future operation during report or articles preparation.

For the database creation our software can launch an acquisition batch which is stored in a database (SQL database). To launch an acquisition batch, choose the name of the batch (12 characters maximum, unique name).

During and after your fermentation process you can choose the process or the processes by the batch name. It/they will be shown on a graph.

graph
Graph

After you choose a trend by checking its box, you can display the selected trends on a graph.

For optimisation of your fermentation trends we have many useful features like:

Export to CSV

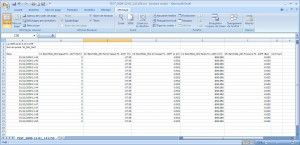
For working with your cultivation dates in another programs software allows to save a selection in the format “CSV” to handle the data with the software EXCEL for example, this saving have to be done on an external support (usb key for example) or on a network drive.

Export to CSV
Export to CSV